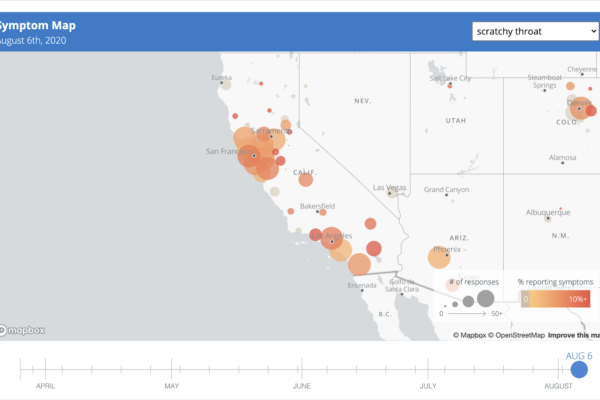
The COVID-19 Citizen Science study website now displays an interactive map designed to illustrate symptom progression among our study participants over time throughout the United States. Beginning with data from March 26th, 2020, we are mapping key symptoms as a percentage of participants’ daily survey responses from around the country. This map is updated on a daily basis. Our goal is to continue mapping these data for the duration of the study to help identify and predict virus “hotspots” and epicenters.
View the interactive map at: https://covid19.eurekaplatform.org/#map
Use the slider at the bottom of the map to scroll through dates to see changes in reported symptoms. Use the dropdown in the top right hand corner to change between different symptoms.


