
For many participants in the BEAT-AFib study, the electrocardiogram, or ECG, is a familiar test performed to quickly assess the heart’s rhythm and electrical activity. However, the ECG we perform — called a high-resolution or signal-averaged ECG — in the BEAT-AFib study is longer than the typical one that your doctor may perform. An ECG is comprised of 3 main “waves” that we look at: a P wave, which represents the electrical activity (depolarization) of the atria (top two chambers), a QRS wave that represents the ventricular (bottom chambers) electrical activity, which is much larger than the atria and is thus a much larger wave, and the T wave which represents the return of electrical activity in the ventricles to baseline (called repolarization). By recording a 15-minute ECG, we can collect enough heartbeats to perform a high resolution signal averaged ECG which allows us to see very tiny signals that aren’t evident with a normal ECG. Since the P wave represents activity in the atria, we are specifically interested in studying this wave in patients with atrial fibrillation or those at risk for AFib.
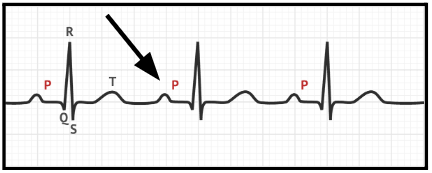
Figure 1: Labeled segments of a wave in an ECG. Arrow is pointing to an example of a P-wave.
Research indicates that P-wave signal average electrocardiography (P-SAECG) can potentially identify patients who are at risk for developing paroxysmal (intermittent) atrial fibrillation and those likely to progress to longer-lasting and permanent AFib.1 P-SAECG is more advantageous than a standard ECG due to its ability to record low-level electrical signals through the use of signal processing. This allows P-SAECG to identify patients with subtle changes in electrical signals in the atria, which may be important in the development of arrhythmias like atrial fibrillation. Because of the low-level P wave signals, the recorded ECG needs to be clean of artifacts (signals coming from patient movement/muscle tension) which is why it’s very important to keep as still and relaxed as possible for the duration of the recording.
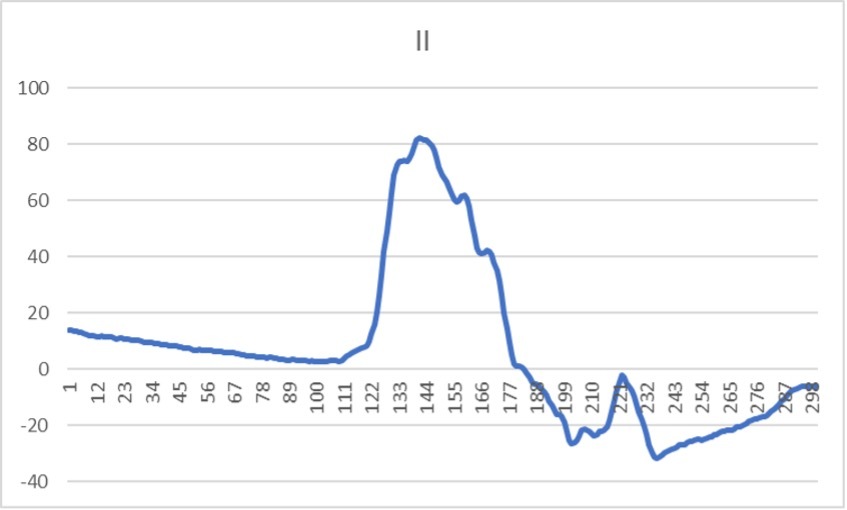
Figure 2: P-SAECG showing only the P wave component. Notice the “extra” information in the notching and more complex signal compared to the regular ECG.
By obtaining sufficient P-wave data from these 15-minute ECGs, we hope to further identify new features of the P wave that might predict the occurrence or progression of AFib, and validate prior research. If we are successful, the P-SAECG could be a simple and non-invasive predictor of AFib and AFib progression.